2000: Insanity in individuals is something rare — but in groups, parties, nations, and epochs it is the rule.
–Friedrich Nietzsche, Beyond Good and Evil (Apophthegms and Interludes, no. 156), in The Philosophy of Friedrich Nietzsche (New York, Modern Library, n.d.), p. 468.
-
Some Summer Reading
2026: People are always asking me what I’m reading. Because I think and talk and read about investing all day long, I typically don’t read financial…

Latest articles
-
Summon Your Courage and Buy Stocks
-
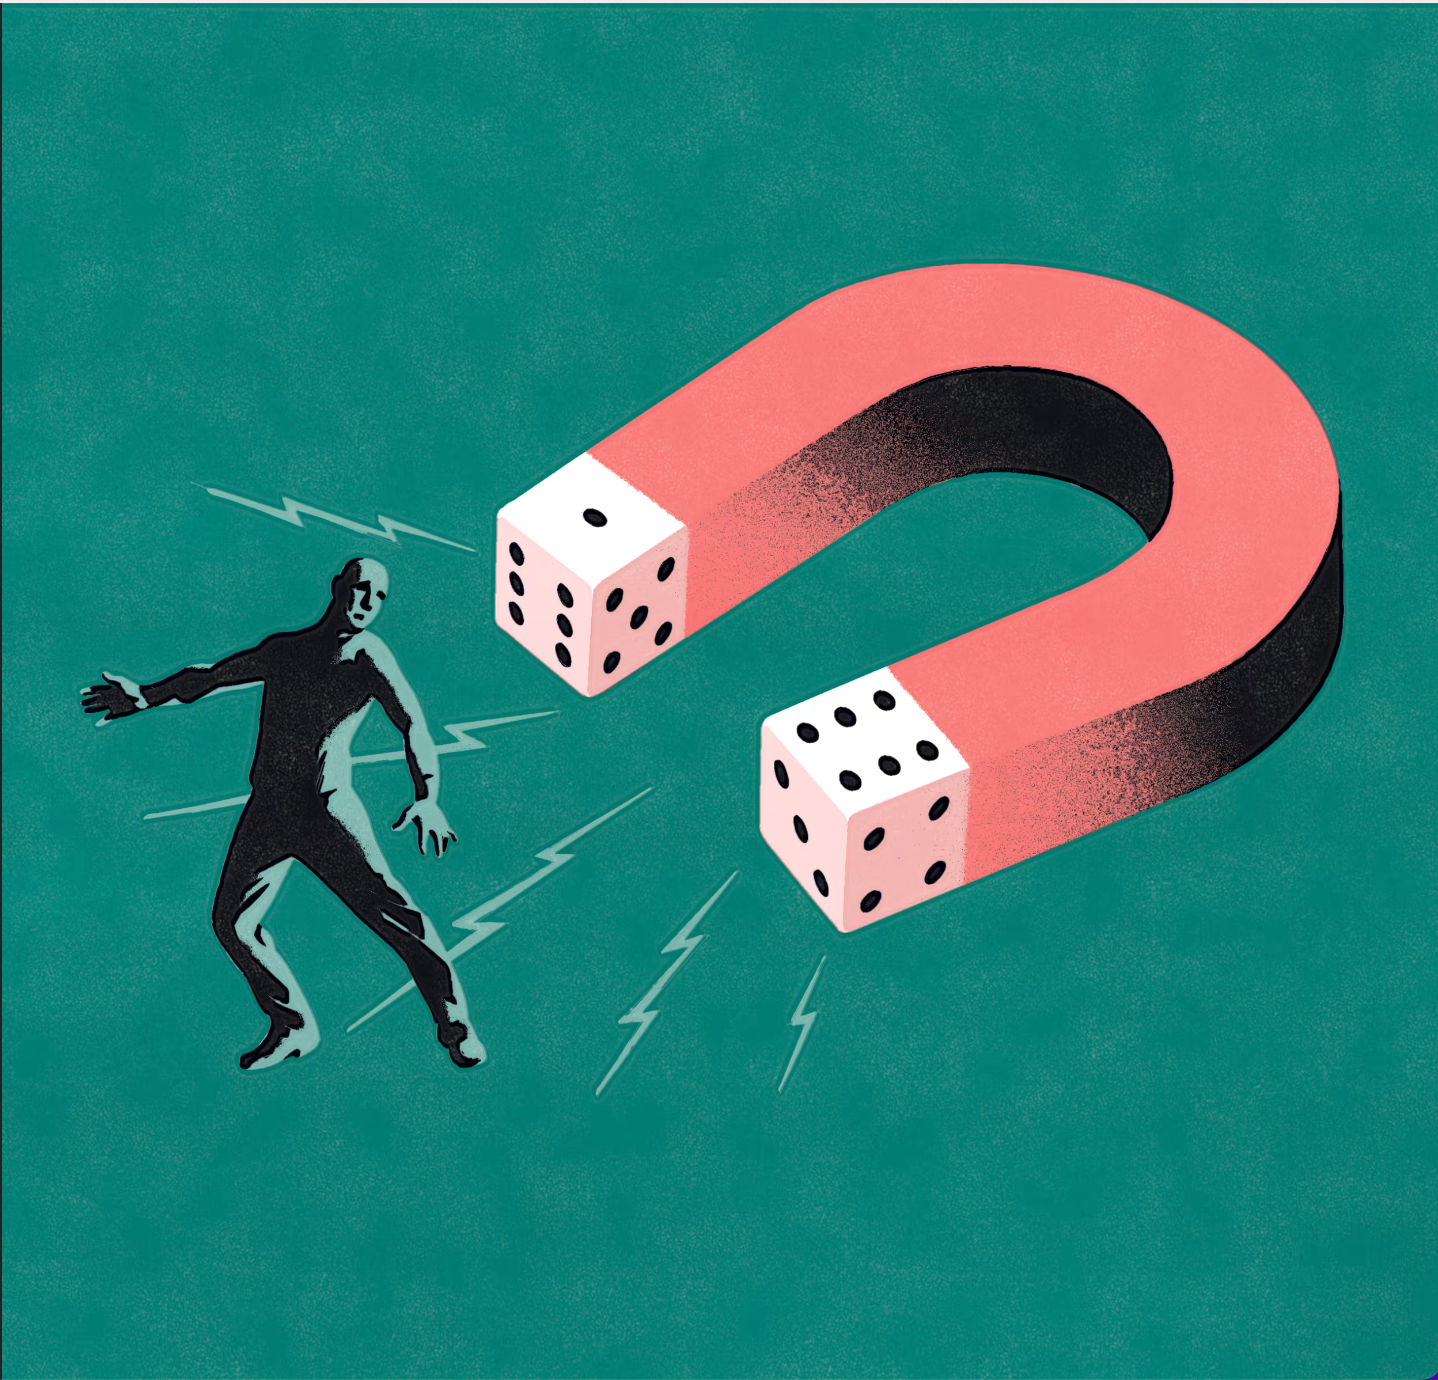
What’s Luck Got to Do with It?
-
You’re Not Paranoid. The Market Is Out to Get You.
-

Messing Up the Closest Thing to a Sure Thing in the Stock Market
-

What Bill Ackman Got Wrong With His Bungled IPO
-

A Couple Won the Powerball. Investing It Turned Into Tragedy
-

Why Your Fund Manager Can’t Beat Today’s Stock Market
-

Hot Funds and the Curse of ‘Self-Inflated Returns’
-

Thought of the Day
Money in Art, Money in Culture


Books
Jason is the author of “Your Money and Your Brain,” on the neuroscience of investing, and the editor of the revised edition of Benjamin Graham’s “The Intelligent Investor,” the classic text that Warren Buffett has described as “by far the best book about investing ever written.”